Database Solution and Performance Tuning
A large restaurant chain was facing an MS SQL database performance issue along with a scalability issue. Their application went down several times due to database health issues. The customer has engaged us to find the root cause of the database issue. We worked with the customer's application team closely and helped them to fine-tune their store procedure, functions, and other select queries. Overall, they wanted the database to be scalable and highly available. We proposed the optimum solution in cost-effective way and successfully implemented.


Solutions Brief
A large restaurant chain was facing an MS SQL database performance issue along with a scalability issue. Their application went down several times due to database health issues. The customer has engaged us to find the root cause of the database issue. We worked with the customer's application team closely and helped them to fine-tune their store procedure, functions, and other select queries. Overall, they wanted the database to be scalable and highly available. We proposed the optimum solution in cost-effective way and successfully implemented.
We applied below steps to figure out the issue.
Database Engine Tuning Advisor
Database Engine Tuning Advisor can help you analyze the performance of Transact-SQL statements executed against your databases as part of tuning. The Advisor provides a wizard you can use to analyze the performance impact of Transact-SQL queries. Beyond that, it provides recommendations, for example, suggesting that you create or delete indexes.
Identifed Suspect Queries
Used the following T-SQL code to find the 20 lowest performing queries. Note that even if the maximum average run time is high, the impact on the database will be small if the query is rarely used. Conversely, even if a query has a moderate average run time, but is run many times a day, it will create a much higher load on the database.
|
SELECT TOP 20
total_worker_time/execution_count AS Avg_CPU_Time
,Execution_count
,total_elapsed_time/execution_count as AVG_Run_Time
,total_elapsed_time
,(SELECT
SUBSTRING(text,statement_start_offset/2+1,statement_end_offset
) FROM sys.dm_exec_sql_text(sql_handle)
) AS Query_Text
FROM sys.dm_exec_query_stats
ORDER BY Avg_CPU_Time DESC
|
Management Studio Performance Dashboard
A quick way to identify performance issues in a currently-running SQL Server instance.
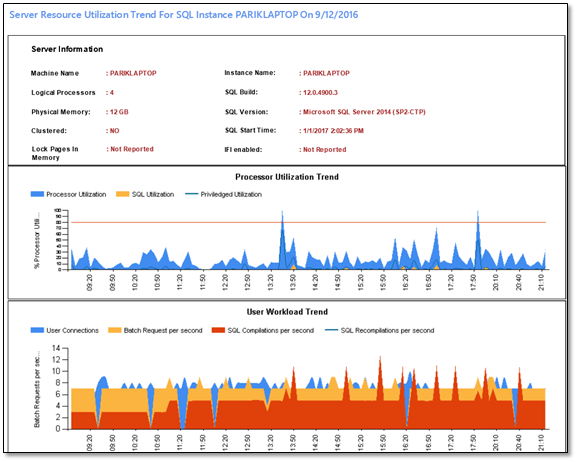
Image Source: Microsoft
Query Store
It helped us quickly detect performance differences due to query plan changes. The tool automatically collects and displays historical queries, query plans, and execution data. Query Store lets you view data according to time intervals, to identify patterns of database usage and understand how query plan changes impact the database.
Database Engine Tuning Advisor (DTA)
Analyzed the impact of a Transact-SQL statement on the database to optimize performance. DTA provides automated instructions for modifying indexes, views, or partitions to improve performance.
Database Experimentation Assistant (DEA)
A new solution for SQL Server performance tuning, using the concept of A/B testing. This is a great way to evaluate specific versions of the SQL Server database engine for specific workloads.
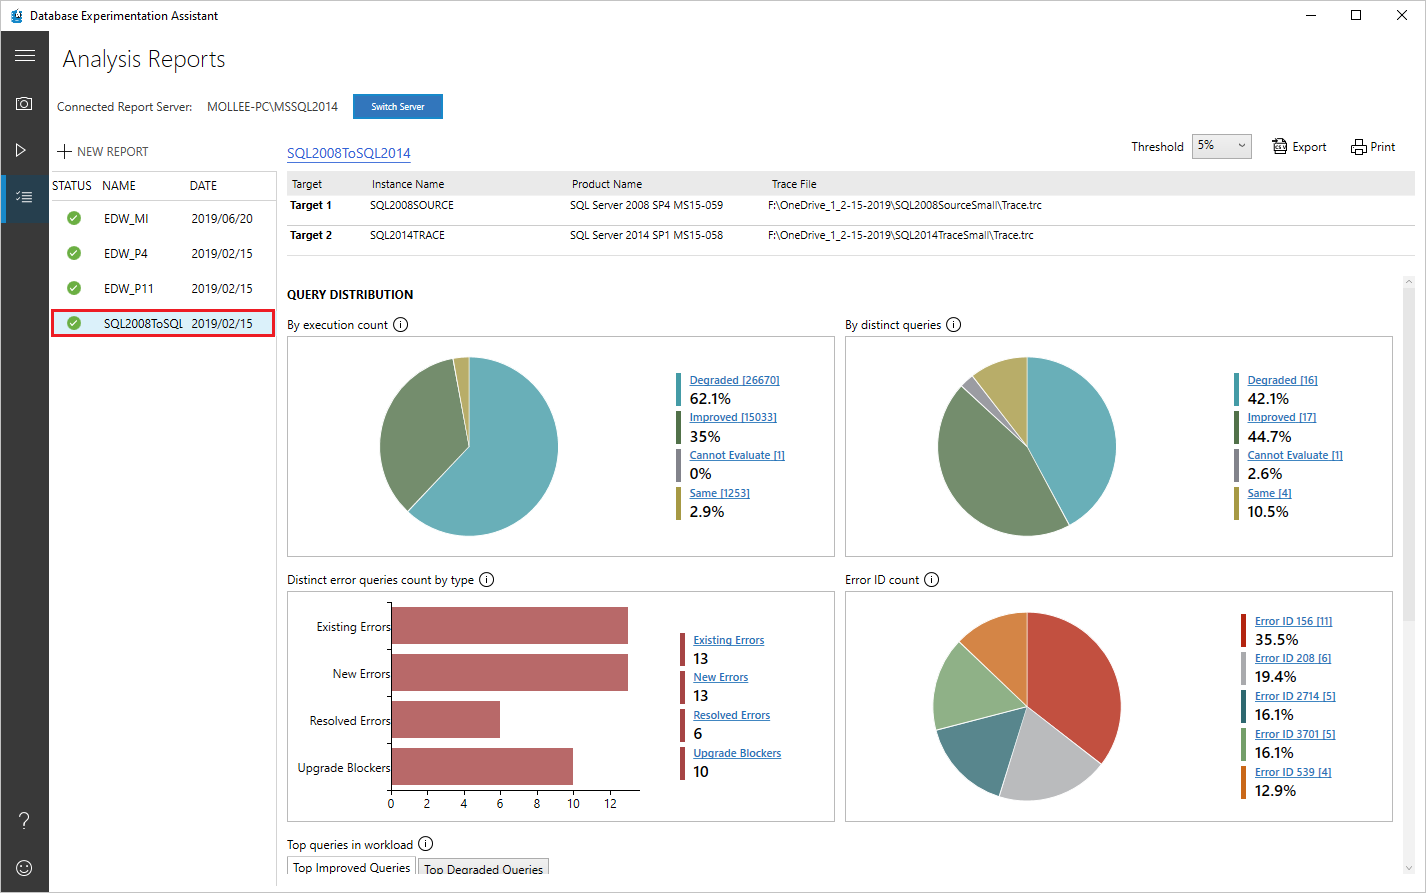
Image Source: Microsoft
Windows application event logs
Provides information on events recorded by SQL Server, the SQL Server Agent, and the text search process, which you cannot get from other tools, and can be valuable in SQL server performance tuning. You can use it to diagnose and solve many types of problems. We used the same to address the issue.
Extended events
A lightweight monitoring tool provided by Microsoft, which provides three dashboards for managing and analyzing session data: New Session Wizard, XE Profiler, and New Session.
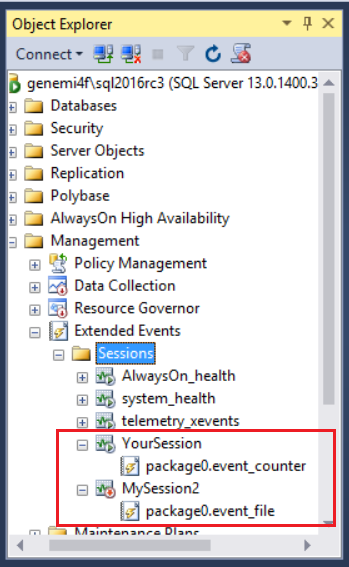
Image Source: Microsoft
Live Query Statistics (LQS)
Helped us real-time data about query execution. This is very useful for troubleshooting query performance as part of SQL Server performance tuning.
System Monitor (resource usage)
Provideed data on database resource usage, such as the number of page requests in the buffer manager. You can use it to track performance by defining counters and objects for specific events.
Management Studio Open Activity Monitor
Provided a snapshot of current activity in the database, including, including system processes currently running or blocked, database locks, and activity of user accounts.